Access / Request Log
Dshackle can log all requests to a file in JSON format. Or JSON Lines to be more precise, i.e., a test file where each line is a JSON.
|
Note
|
By default, the access log is disabled. |
To enable access log add following configuration:
accessLog:
  enabled: true
  filename: /var/log/dshackle/access_log.jsonl
filename is optional, and the default value is access_log.jsonl (i.e., in the current directory).
Since a single request may contain multiple replies (ex., a batch call, or subscribe to the head blocks) the Dshackle logging is based on replies. The access log file contains details per each response send from the server, and each of them refers to original request details.
The access log contains the JSON lines similar to:
{
  "version":"accesslog/v1beta",
  "ts":"2021-07-20T01:53:33.174645Z",
  "id":"578d83db-cf53-4ef8-b73e-3f1cc0a67e96",
  "method":"NativeCall",
  "channel":"GRPC",
  "blockchain":"ETHEREUM",
  "total":2,
  "index":0,
  "succeed":true,
  "request":{
    "id":"513b9b49-b472-4c83-b4b7-58dd2aabe9f6",
    "start":"2021-07-20T01:53:33.086946Z",
    "remote":{
      "ips":["127.0.0.1", "10.0.5.102", "172.217.8.78"],
      "ip":"172.217.8.78",
      "userAgent":"grpc-node-js/1.1.8"
    }
  },
  "nativeCall":{
     "method":"eth_blockNumber",
     "id":2,
     "payloadSizeBytes":2
  }
}-
tstimestamp of the reply -
iduniq id of the reply -
methodDshackle method which was called (i.e., not a Blockchain API method, seenativeCalldetails) -
blockchainblockchain code -
channelaccess channel (GRPCfor native Dshackle calls,JSONRPCfor JSON RPC HTTP Proxy) -
totalhow many requests in the batch (available only for aNativeCallcall) -
indexcurrent index (i.e. count) of the reply to the original request -
succeedif call succeeded, in terms of Blockchain API -
requestoriginal request details-
iduniq id of the request; all replied to the same request have same id -
startwhen request was received -
remoteremote details-
ipslist of all recognized IPs (including headers such asX-Real-IPandX-Forwarded-For) -
ipa single ip, that likely represent a real IP of the remote -
userAgentuser agent
-
-
-
nativeCalldetails of the individual Native Call request-
methodmethod name terms of Blockchain API -
idrequest id provided in the original request -
payloadSizeBytessize of the original individual request (for JSON RPC it’s size of theparamsvalue)
-
Prometheus Metrics
By default, Dshackle provides Prometheus metrics on http://127.0.0.1:8081/metrics.
To configure the metrics use:
monitoring:
  enabled: true
  jvm: false
  extended: false
  prometheus:
    enabled: true
    bind: 192.168.0.1
    port: 8000
    path: /status/prometheus
Where jvm options enabled monitoring of the JVM internals, such as memory, GC, threads, etc.
And extended enables additional metrics for query selectors, etc.
Grafana Dashboard
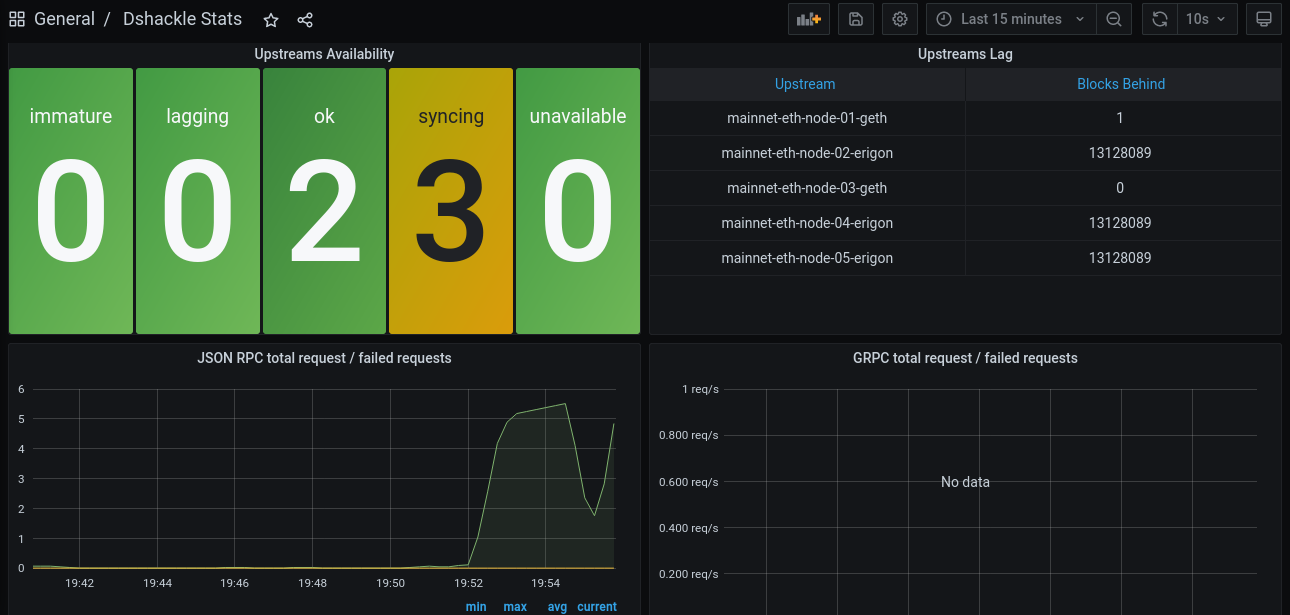
Simple Grafana dashboard available here

This dashboard contains:
-
Upstreams Availability
-
Upstreams Lag
-
JSON RPC total request / failed requests
-
GRPC total request / failed requests
-
JSON RPC Response time
-
Upstreams Errors
-
JSON RPC upstream conn seconds 50,75,90,99 percentiles
Health Checks
Dshackle provides a http endpoint to check status of the servers. This check is compatible with Kubernetes Liveness and Readiness Probes.
By default, it’s disabled, and you have to set up which blockchain are required to be available to consider Dshackle alive.
health:
  port: 8082 # (1)
  host: 127.0.0.1 # (2)
  path: /health # (3)
  blockchains: # (4)
    - chain: ethereum # (5)
      min-available: 2 # (6)
    - chain: bitcoin
min-available: 1-
(optional) port to bind the Health server. Default:
8082 -
(optional) host to bind the Health server. Default:
127.0.0.1 -
(optional) path on the server. Default:
/health. I.e.,http://127.0.0.1:8082/healthwith default config -
list of blockchain to check availability
-
a Blockchain to check
-
minimum available (i.e., fully synced) Upstreams for that blockchain
With the config above the server is considered healthy if:
-
Dshackle has connected to at least two valid Ethereum upstreams
-
and at least one valid Bitcoin upstream.
When the server is healthy is responds with OK and 200 as HTTP Status Code.
When any of the checks failed, it responds with a short description and 503 as HTTP Status Code.
Example of a response for an unhealthy server that doesn’t have enough upstreams for a Ethereum Classic Blockchain.
ETHEREUM_CLASSIC UNAVAILABLE
Optionally, the server can be called with ?detailed query, which provides a more detailed response:
ETHEREUM_CLASSIC UNAVAILABLE
BITCOIN AVAILABLE
  local-btc-1 OK with lag=0
ETHEREUM AVAILABLE
  local-eth-1 OK with lag=0
  local-eth-2 OK with lag=0
Tracing
Dshackle provides an option to send spans to the DRPC tracing system to see the detailed path of a request and investigate some problems.
By default, this feature is turned off. To turn it on set the env variable ENABLE_COLLECT_SPANS to true.
Dshackle sends spans for a request:
-
which has completed with an error
-
which has at least one long span. Threshold to assume that a span is long is 1000 milliseconds by default, and you can control this value by passing the env variable
LONG_SPAN_THRESHOLDin milliseconds. If you pass 0 it means that spans for all requests will be sent to the tracing system.